
New GLASSNET tools on MyGeoHub advance international, interdisciplinary research
Two new climate, land-use, and agricultural data tools developed by GLASSNET team members have recently been added to the online platform MyGeoHub (mygeohub.org), allowing researchers across domains to easily access the data they need to assess progress towards meeting the United Nations Sustainable Development Goals (SDGs).
GLASSNET, a five-year,  NSF-funded project, is a global collaboration—a network of networks—aimed at understanding global drivers of local sustainability challenges, as well as the regional, national, and global consequences of local responses to these stresses. The intent of the GLASSNET network is to provide decision-makers from a wide array of areas with the data and models needed to properly assess actions that will affect the environment, the economy, and local communities. Although the different teams within the GLASSNET group hail from different fields, they all recognize that we live on a changing planet with limited water and land resources and that achieving global SDGs is of the utmost importance. They also recognize a major impediment to reaching these goals is the traditional isolation of scientific domains and the difficulty researchers have in communicating across different fields.
“GLASSNET is important,” says Thomas Hertel, Distinguished Professor of Agricultural Economics at Purdue University and principal investigator for the GLASSNET project, “because these challenges that we face—challenges to climate, food security, water availability, water quality, sustainability of the planet—are huge challenges, and the only way we can address them is through multidisciplinary collaboration. Economists can’t do the job. They need to be involved, but if you don’t have hydrologists, you’re not going to understand the water challenges. If you don’t have ecologists, you won’t be able to come to grips with the potential impacts on biodiversity. You need many disciplines involved, and the challenge has always been to get them to collaborate and work together. That’s what GLASSNET is about—bringing these networks together. And one of the deepest ways you can bring different networks together is through the sharing of data and model results. Ultimately, we want to be able to share this knowledge at a fundamental level and build on one another’s work. GLASSNET is aimed at facilitating this type of deep collaboration.”
To help achieve these global SDGs, the GLASSNET team has been hard at work developing multiple, easy-to-use data tools. Some of their most recent contributions include an updated version of the ‘AgMIP tool’ for assessing local climate impacts on agriculture across the globe. Another new tool is dubbed ‘LandInG’. This allows users to generate historical data sets for global land use and agricultural practices. These land use data sets are the foundation of research by all of the networks involved in GLASSNET.
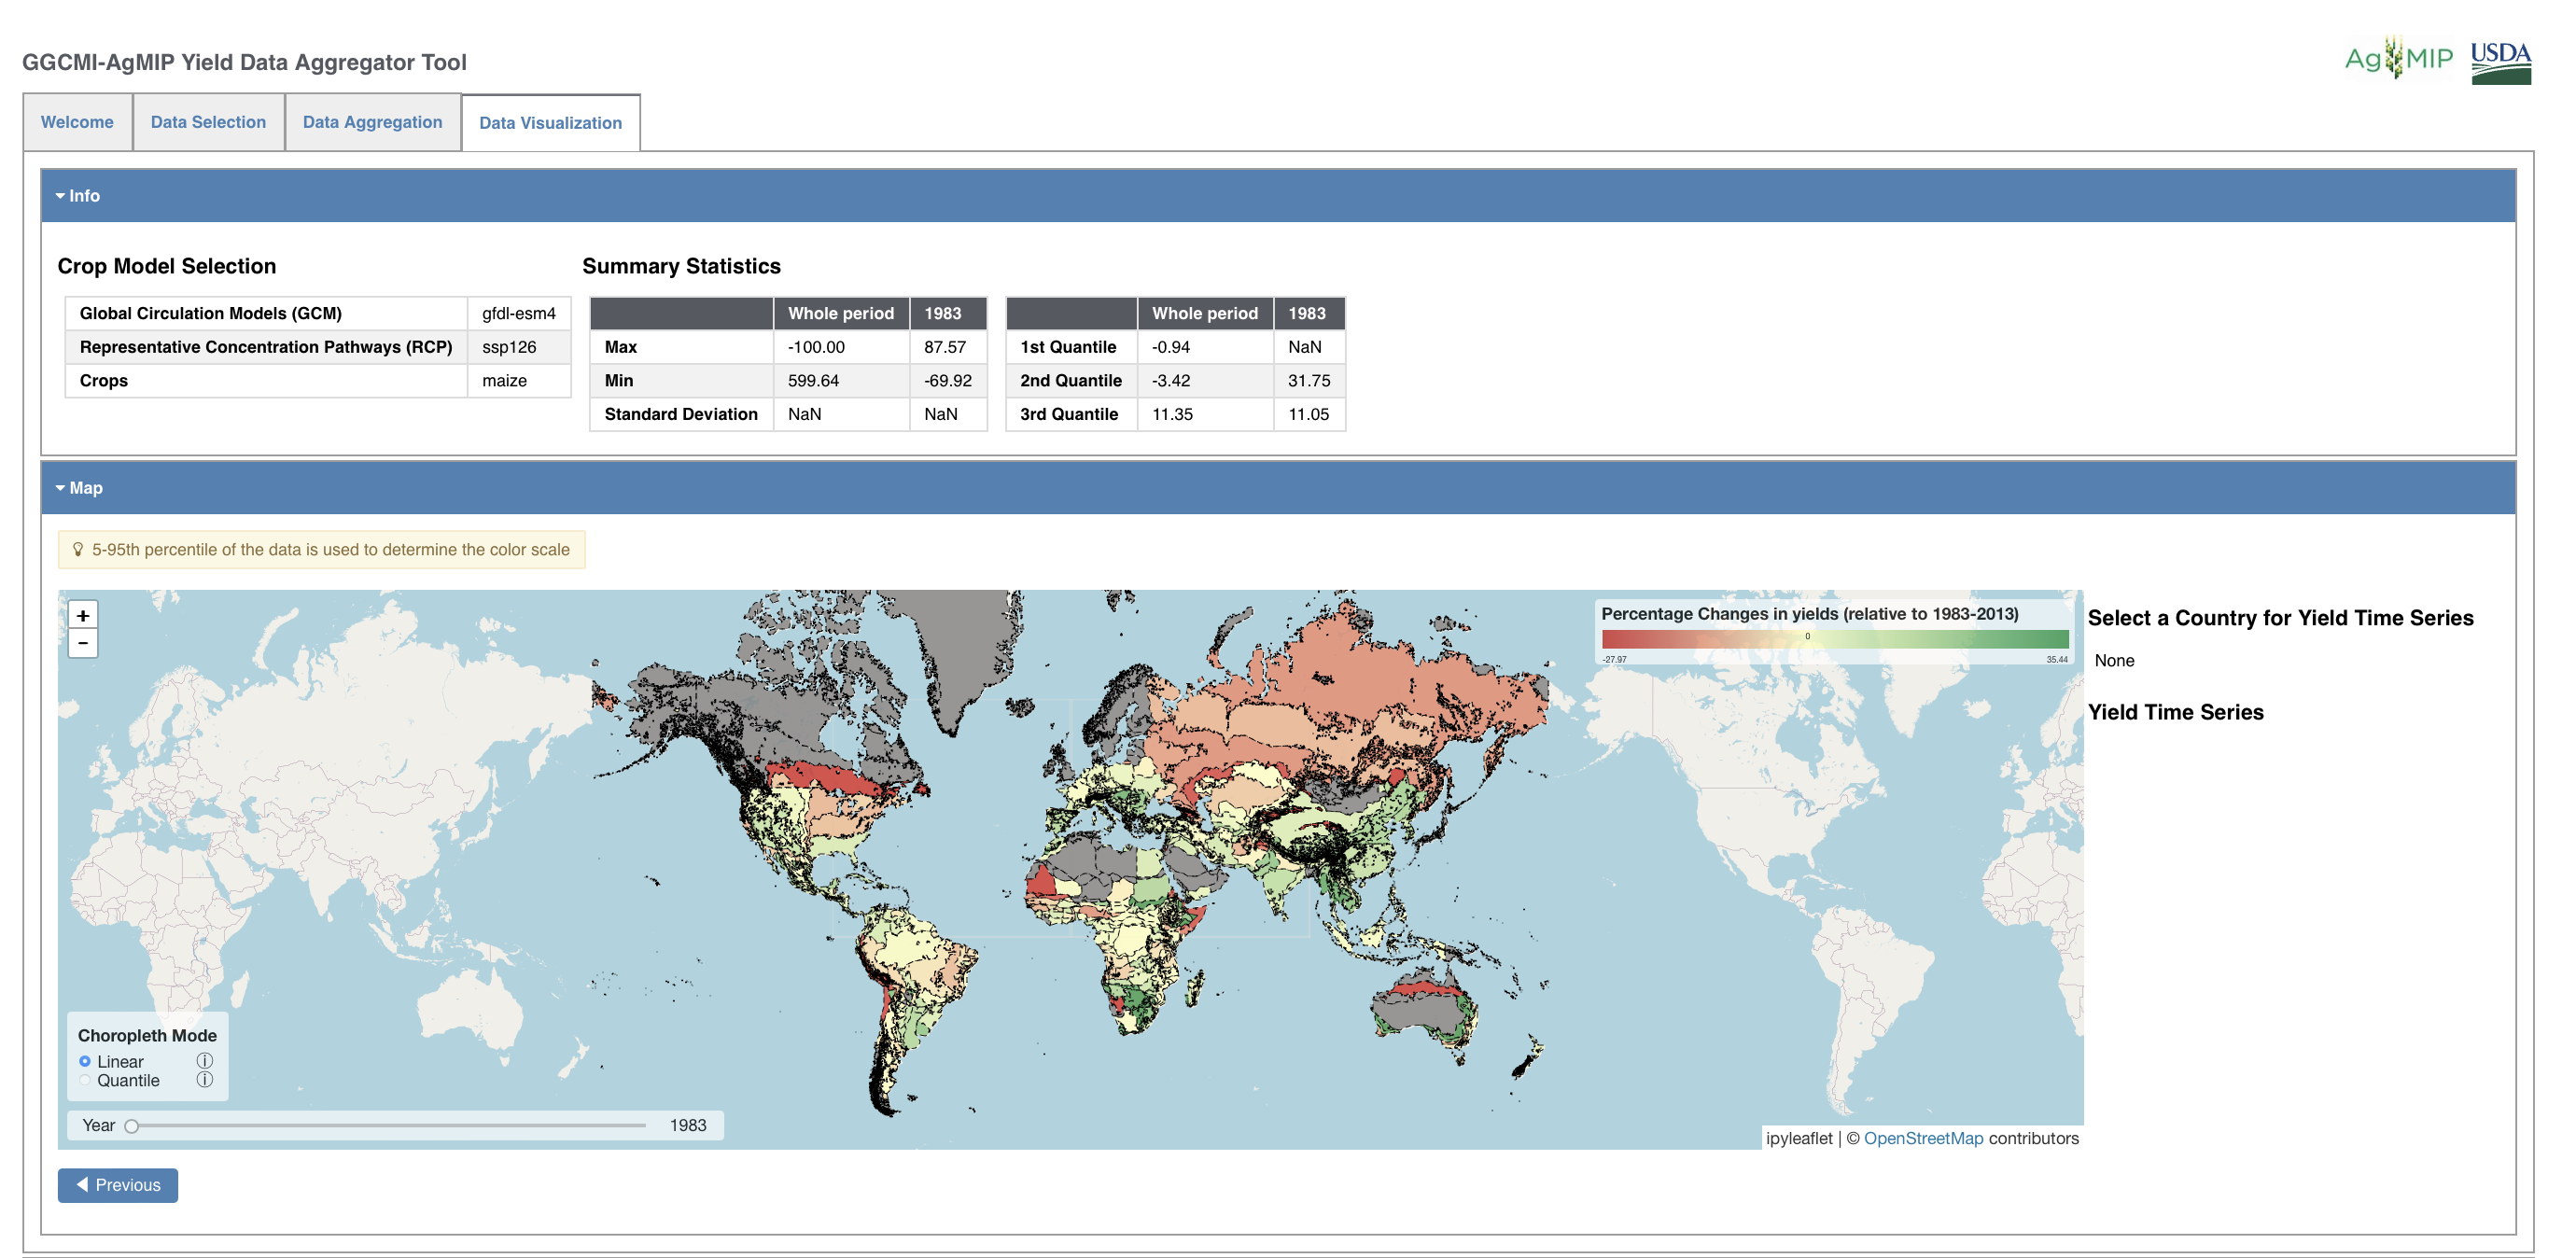
AgMIP Data Aggregator Tool
The Agricultural Model Intercomparison and Improvement Project (AgMIP) is one of the network members in GLASSNET, and the AgMIP Data Aggregator Tool is a perfect example of the connectivity that GLASSNET facilitates while showing how useful such connectivity can be. Within AgMIP, the Global Gridded Crop Model Intercomparisons (GGCMI) network, led by GLASSNET member Dr. Christoph Müller from the Potsdam Institute of Climate Impact Research, conducts global assessments of the impact of climate change on crop yields over the 21st century. By combining results from a dozen different crop models, the GGCMI group seeks to provide robust estimates of these impacts at fine-scale, worldwide, for five different climate models drawn from the most recent work by the Climate Model Intercomparison Project (CMIP6). However, these results are held in massive files in formats that are not easily accessible by most economists and other social scientists seeking to assess the broader impacts of climate change on agriculture. Dr. Nelson Villoria of Kansas State University – a GLASSNET collaborator – took the initiative, with funding from USDA, to work with the Purdue Research Software Engineering (RSE) team to implement a tool on MyGeoHub which allows economists and others to access these massive files and sort through the results, selecting the appropriate impacts and aggregating them to a scale (e.g., yield changes for maize in the US) required for global economic analysis.
Aside from being the PI of GLASSNET, Dr. Hertel is also the Executive Director of the Global Trade Analysis Project (GTAP) – a network of 28,000 economists from around the world studying global issues, including climate change. Regarding the importance of the AgMIP Data Aggregator Tool, he notes:
“Those who benefit most from this tool are scientists from other disciplines. Most economists, for example, are not well-versed in the complexities of climate and crop models, but they need to understand the implications of future changes in agricultural yields in order to assess the likely impacts on production, prices, and food security.” Dr. Hertel notes that members of the GTAP network are heavy users of the AgMIP tool. “Any time we want to do something with climate impacts and agriculture, we go to that tool rather than spending a year’s time trying to figure out the right answer for ourselves. What we need in the end is the overall impact on maize yields in the US. It is nice to know we are building our analysis on the latest science, even if we don’t understand all the complexity behind their estimates. The AgMIP tool communicates all the complex information at a relevant level of detail for our economic analysis.”
Economists, farmers, investors, climate scientists, government officials—the list of people who will rely on the AgMIP Data Aggregator Tool goes on and on, filled with individuals and groups who must make decisions regarding the future of our food supply. As such, the tool needed to be comprehensive yet easy to access and utilize. These requirements are what led GLASSNET to host the tool on MyGeoHUB, where anyone with an account can sign in and use a multitude of geospatial modeling, data analysis, and visualization tools for free. To access the AgMIP Data Aggregator Tool, please visit the GLASSNET home page: https://glassnet.net.
LandInG 1.0 toolbox and LandInG Viewer
The Land Input Generator version 1.0 (LandInG 1.0) is a new toolbox for generating input datasets for a whole host of models used by members of the GLASSNET community. Its development was led by GLASSNET members Drs. Sebastian Ostberg and Christoph Müller, who are based at the Potsdam Institute for Climate Change Research (PIK). The toolbox provides, for the first time, an open-source set of scripts that allow users to build a globally consistent database from publicly available data sets, based on their preferred source data and assumptions. The LandInG toolbox is designed to make inconsistencies between different data sources transparent, thereby drawing attention to the areas and types of data requiring future investment and attention. It documents the sources and processing steps of data-to-model inputs and also lets users make changes in spatial resolution. This gives users the option of making their own decisions on how to resolve data inconsistencies, if they are unhappy with the default assumptions of the toolbox.
“One of the big puzzles we face is, ‘How is the world’s land being used?, and how has this evolved over time?’” says Dr. Hertel. “There’s no one definitive source. It’s a massive exercise of data reconciliation. Everyone starts with the same kind of information that’s out there—some satellite information, some census information, etc.—and they put it together to try and come up with a consistent story. The problem is, there are so many assumptions made along the way, and each group around the world creates its own workflow to develop a usable database, but none of them are the same, and no one knows what the workflow is. These data inconsistencies, in turn, lead to spurious differences in model results. This can be confusing for decision-makers who seek to understand, for example, the impact of climate change on future land use. The LandInG team published, for the first time, an open-source workflow, so anyone can replicate the database construction and go from the public information available to a global, gridded database of land use, which is what everyone needs in the end.”
For scientists and researchers who don’t need to look behind the curtain, LandInG provides immediate access to fine-scale global land use data. For those who want more insight into how that data was produced so that they can make changes as they see fit, they have access to the workflow. This is an invaluable asset to have, not only for replicating scientific efforts, but for making changes to some assumptions and being able to compare results.
To help facilitate immediate usage of the LandInG 1.0 toolbox, I Luk Kim, Lan Zhao, Carol Song, and the MyGeoHub team developed the LandInG Viewer tool, now available online on MyGeoHub. The LandInG Viewer provides access to a subset of the data sets that can be created using the full LandInG 1.0 toolbox. It eliminates the need for advanced computing resources and knowledge and lets anyone with a free account simply download the data based on the specific parameters of their choice. The data set available on the LandInG Viewer provides global coverage at a spatial resolution of 5 arc minutes or 30 arc minutes. It includes:
-Time series of crop-specific fertilizer application rates (5 arcmin)
-Time series of crop-specific harvested areas (5 arcmin)
-Time series of manure application rates on cropland (5 arcmin)
-Soil texture (5 arcmin & 30 arcmin)
-Soil acidity (pH) (5 arcmin & 30 arcmin)
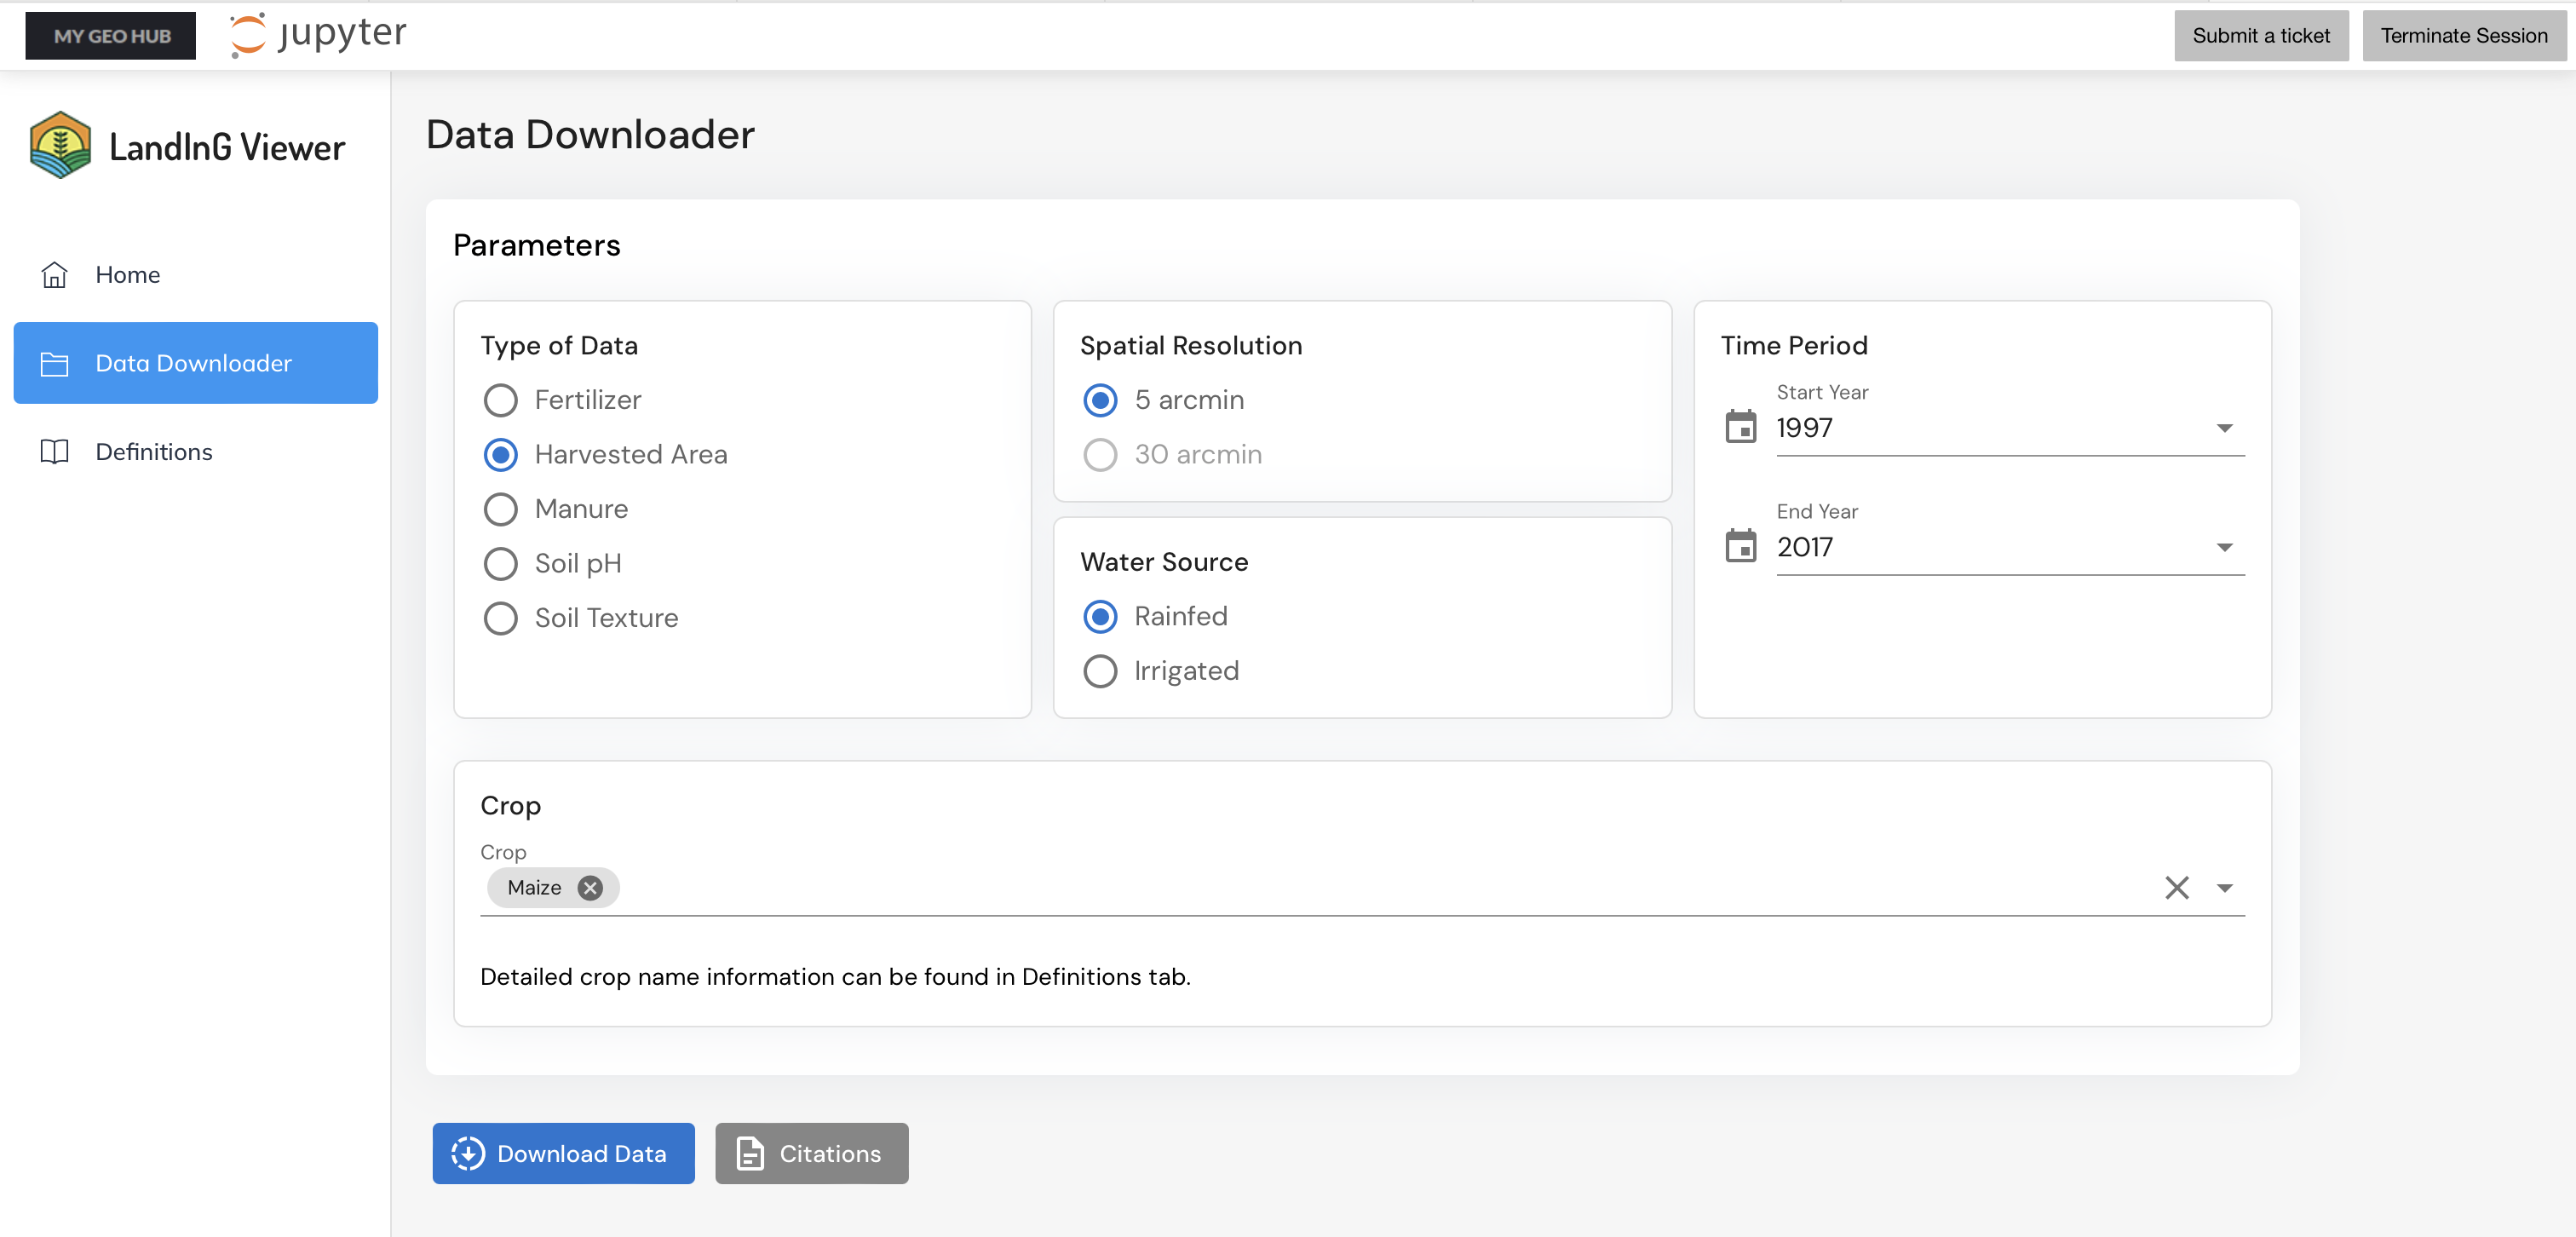
The full LandInG 1.0 toolbox also covers land, country and region masks, river networks, freshwater reservoirs, and irrigation water distribution networks and allows for easy changes to the spatial resolution. But for those who are not tech-savvy, making these changes or adjusting assumptions in the workflow could be very difficult. In fact, according to Dr. Hertel, the intent is for future versions of the LandInG Viewer tool to permit researchers to run the full workflow under different assumptions, all online with an easy-to-use interface on MyGeoHub. The researchers would be able to create their customized land use data by dynamically changing configurations, bringing their own datasets, and then running the toolbox in the backend, all without having to deal with the scripts in the toolbox directly. This will lower the barrier considerably for researchers across domains, removing the obstacle of having to learn advanced computing before being able to take advantage of the full dataset contained within the LandInG 1.0 toolbox. Grants for such a project have been written, and funding opportunities are actively being pursued.
Anyone with a MyGeoHub account can access the LandInG Viewer. To find the tool, please visit GLASSNET’s online tool page, https://mygeohub.org/groups/glassnet/res/tools/. For access to the full Landing 1.0 toolbox, you can go to its page on GitHub: https://github.com/PIK-LPJmL/LandInG/tree/main
Creating Connections and Enabling Innovation
While developing useful tools is an important part of what GLASSNET does, it isn’t all. GLASSNET was created with one main function in mind—to foster connectivity and collaboration. As part of a larger NSF initiative known as AccelNet (Accelerating Research through International Network-to-Network Collaborations), GLASSNET’s funding is not primarily for research, but for connecting people.
“GLASSNET brings networks together to inform research,” says Dr. Hertel. “A big component of doing this lies in scholarly exchange. We’ve sent a number of young researchers overseas, and researchers from overseas have come to the U.S., all to connect and share ideas and learn new approaches. So it’s not just software, it’s people moving back and forth and learning from different disciplines and different countries.”
In fact, it was during one of the scholarly exchanges that Dr. Hertel first learned about the LandinG 1.0 toolbox. He was in Germany for seven months at the Potsdam Institute for Climate Impact Research, where he had an office next to Dr. Christoph Müller, who was leading the team that developed the LandInG 1.0 toolbox. This connection led to the toolbox being adopted and promoted by GLASSNET, which eventually led to the development of the LandInG Viewer tool.
Another component of the GLASSNET project is to foster connectivity by making sure all software that is produced is easy to access and use, so that any researcher from any field can use the tools, even if they have limited resources. This is why the MyGeoHub platform is so consequential.
MyGeoHub is a geospatial science gateway that supports the geospatial modeling, data analysis, and visualization needs of the broad research and education communities. The platform does this by hosting groups, datasets, tools, training materials, and educational content. Anyone can create a free account and use the infrastructure and resources to further their own research and educational activities.
“That is the beautiful thing about MyGeoHub—worldwide availability,” says Dr. Hertel. “Imagine that you’re a researcher who doesn’t have access to high-performance computing. Or maybe you work mostly from your laptop in Starbucks. Well, now you can sign into MyGeoHub, and you can do this very sophisticated data processing and end up downloading a spreadsheet which has the information you need for your study. Even though you don’t have a computer that can ingest all of these climate results, you can access the data through MyGeoHub. So it really levels the playing field in terms of research and allows people in under-resourced situations to undertake cutting edge research.”
MyGeoHub is a crucial platform for enabling innovation, and not just through GLASSNET. For a full list of research projects hosted on MyGeoHub, please visit https://mygeohub.org/researchprojects.
To learn more about the GLASSNET project, please visit the GLASSNET homepage. GLASSNET is funded under NSF award number 2020635.
AgMIP Data Aggregator Tool: Jonas Jägermeyr; Christoph Müller; Nelson Benjamin Villoria; Jayson Beckman; I Luk Kim; Lan Zhao (2024), “AgMIP Data Aggregator Tool,” https://mygeohub.org/resources/agmipagg. (DOI: 10.21981/1XJY-C362).
LandInG 1.0 Toolbox: Ostberg, Sebastian, Christoph Müller, Jens Heinke, and Sibyll Schaphoff. “LandInG 1.0: Toolbox to Derive Input Datasets for Terrestrial Ecosystem Modelling at Variable Resolutions from Heterogeneous Sources.” Geoscientific Model Development 16, no. 11 (June 15, 2023): 3375–3406. https://doi.org/10.5194/gmd-16-3375-2023.
LandInG Viewer: Lan Zhao; I Luk Kim; Christoph Müller; Sebastian Ostberg; Uris Lantz C Baldos; Tom Hertel; Jan Philipp Dietrich (2023), “LandInG Viewer,” https://mygeohub.org/resources/landingviewer. (DOI: 10.21981/YA39-TF44).
Written by: Jonathan Poole, poole43@purdue.edu