
Link to section 'Profilers' of 'Profilers' Profilers
Link to section 'NVIDIA Nsight Tools Overview' of 'NVIDIA Nsight Tools Overview' NVIDIA Nsight Tools Overview
Link to section 'Table of Contents' of 'NVIDIA Nsight Tools Overview' Table of Contents
Link to section 'Overview' of 'NVIDIA Nsight Tools Overview' Overview
NVIDIA Nsight tools are a powerful suite of libraries, SDKs, and developer tools designed for profiling, debugging, and optimizing software that utilizes NVIDIA’s latest accelerated computing hardware. These tools support both different platforms targets which incorporate NVIDIA GPU computations, and they assist developers in CUDA development as well as visual computing applications.
Multiple NVIDIA Nsight Developer Tools are available to assist developers with debugging and profiling, with a complete list accessible here. This user guide focuses on NVIDIA Nsight Systems and NVIDIA Nsight Compute.
See the list of available Nsight tools installed on RCAC clusters here.
Link to section 'Available Tools' of 'NVIDIA Nsight Tools Overview' Available Tools
Link to section 'NVIDIA Nsight Systems' of 'NVIDIA Nsight Tools Overview' NVIDIA Nsight Systems
Nsight Systems is a system-wide performance analysis tool that provides insight into CPU/GPU interactions, memory transfers, and API calls.
Key Profiling Features- CPU/GPU utilization tracking
- API call monitoring
- Memory copy analysis
- System-wide performance bottlenecks detection
- Visualizing how data moves through the system
- Parallelization insights for task execution
- Starting point for performance analysis
- Identifying system-wide bottlenecks
- Understanding CPU/GPU interactions
- Analyzing memory transfer patterns
Link to section 'NVIDIA Nsight Compute' of 'NVIDIA Nsight Tools Overview' NVIDIA Nsight Compute
An interactive kernel profiler for CUDA applications, providing detailed performance metrics and API debugging capabilities.
Key Features- Detailed kernel performance metrics
- API debugging capabilities
- Low-level GPU optimization insights
- Guided performance analysis
- Line-by-line code analysis
- Customizable profiling configurations
- Optimizing specific CUDA kernels
- Deep-diving into GPU performance
- Debugging CUDA code
- Fine-tuning kernel configurations
For more information, refer to the NVIDIA Nsight Compute user guide here.
Link to section 'Additional Resources' of 'NVIDIA Nsight Tools Overview' Additional Resources
Source: NVIDIA Tools Ecosystem SessionLink to section 'NVIDIA Nsight Tools on RCAC Clusters' of 'NVIDIA Nsight Tools on RCAC Clusters' NVIDIA Nsight Tools on RCAC Clusters
Link to section 'Tools installed along with CUDA on RCAC clusters' of 'NVIDIA Nsight Tools on RCAC Clusters' Tools installed along with CUDA on RCAC clusters
NVIDIA Nsight tools are installed along with CUDA on the clusters. Below is a list of the tools that can be found on the clusters. Some of these tools have both command-line interface (CLI) and graphical user interface (GUI) versions; for example, nsys has a corresponding GUI version called nsys-ui.
Tool in bin/ |
Corresponding NVIDIA Profiling Tool | Purpose |
|---|---|---|
nsys |
Nsight Systems (CLI) | System-wide performance profiling for CPUs & GPUs |
nsys-ui |
Nsight Systems (GUI) | Graphical user interface for Nsight Systems |
ncu |
Nsight Compute (CLI) | Kernel-level CUDA performance profiling |
ncu-ui |
Nsight Compute (GUI) | Graphical user interface for Nsight Compute |
nvprof |
Deprecated CUDA Profiler | Legacy CUDA profiling tool (replaced by Nsight Compute & Nsight Systems) |
nvvp |
Nsight Visual Profiler (deprecated) | GUI tool for visualizing nvprof results |
compute-sanitizer |
Compute Sanitizer | Memory and correctness checks for CUDA applications |
cuda-gdb |
CUDA-GDB | Debugging CUDA applications using GDB |
cuda-gdbserver |
CUDA-GDB Server | Remote CUDA debugging |
nsight-sys |
Not recommended, use nsys or nsys-ui |
(Alias for nsys, use CLI or GUI version instead) |
Link to section 'Versions Available on RCAC Clusters' of 'NVIDIA Nsight Tools on RCAC Clusters' Versions Available on RCAC Clusters
| Cluster | CUDA | Nsight Systems (nsys) |
Nsight Compute (ncu) |
Compute Sanitizer (compute-sanitizer) |
nvprof (nvprof) |
CUDA GDB (cuda-gdb) |
|---|---|---|---|---|---|---|
| Gautschi | 12.6.0 | 2024.4.2 | 2024.3.0 | 2024.3.0 | 12.6.37 | 12.6 (Based on GDB 13.2) |
| Anvil | 12.0.1 | 2022.4.2 | 2022.4.1 | 2022.4.1 | 12.0.147 | 12.0 (Based on GDB 12.1) |
| Anvil | 11.4.2 | 2021.3.2 | 2021.2.2 | 2021.2.1 | 11.4.120 | 11.4 (Based on GDB 10.1) |
| Anvil | 11.2.2 | 2020.4.3 | 2020.3.1 | 2020.3.1 | 11.2.152 | 11.2 (Based on GDB 8.3.1) |
| Anvil | 11.0.3 | 2020.3.2 | 2020.1.2 | 2020.1.2 | 11.0.221 | 11.0 (Based on GDB 8.2) |
| Gilbreth | 12.6.0 | 2024.4.2 | 2024.3.0 | 2024.3.0 | 12.6.37 | 12.6 (Based on GDB 13.2) |
| Gilbreth | 12.1.1 | 2023.1.2 | 2023.1.1 | 2023.1.1 | 12.1.105 | 12.1 (Based on GDB 12.1) |
| Scholar | 12.1.0 | 2024.4.2 | 2024.3.0 | 2024.3.0 | 12.6.37 | 12.6 (Based on GDB 13.2) |
Link to section 'Where to Find Nsight Tools' of 'NVIDIA Nsight Tools on RCAC Clusters' Where to Find Nsight Tools
When you load a CUDA module, the NVIDIA Nsight tools path will be set depending on the CUDA module you are loading. After loading the CUDA module, you can find the corresponding Nsight tools using commands like which nsys. For example, here is the path on Gautschi:
$ ml spider cuda
----------------------------------------------------------------------------
  cuda: cuda/12.6.0
----------------------------------------------------------------------------
     Other possible modules matches:
        cuda-quantum

    This module can be loaded directly: module load cuda/12.6.0
----------------------------------------------------------------------------
  To find other possible module matches execute:
      $ module -r spider '.*cuda.*'

$ ml cuda/12.6.0
$ which nsys
/apps/gautschi/cuda/12.6/bin/nsys
Link to section 'NVIDIA Nsight Systems' of 'NVIDIA Nsight Systems' NVIDIA Nsight Systems
Link to section 'Table of Contents' of 'NVIDIA Nsight Systems' Table of Contents
- Overview
- Supported Platforms
- Installation
- Profiling and Analysis
- Troubleshooting
- Additional Resources
Link to section 'Overview' of 'NVIDIA Nsight Systems' Overview
NVIDIA Nsight Systems is a powerful tool that enables tracing of any NVIDIA GPU-accelerated application. It generates a holistic, easy-to-understand, and visually pleasing timeline view of system metrics, including all available hardware resources and active processes. This helps developers find performance issues and identify optimization opportunities. Beyond performance investigations, Nsight Systems is an ideal debugging tool for asynchronous GPU computing. Nsight Systems is available as both a CLI and GUI application, useful to different user needs.
Link to section 'Quick Start Guide' of 'NVIDIA Nsight Systems' Quick Start Guide
- Installation: Load the CUDA module on your system:
ml cuda/12.6 - Basic Profiling: Profile your application using the CLI:
nsys profile -o output_name ./your_application - View Results: Either use the CLI to view stats:
Or launch the GUI for visual analysis:nsys stats output_name.nsys-repnsys-ui
For more detailed instructions, see the sections below.
Link to section 'Supported Platforms' of 'NVIDIA Nsight Systems' Supported Platforms
Nsight Systems supports profiling on various platforms and can be used both locally—to profile code running on your machine—and remotely by connecting to targets over SSH or Bluetooth. For more details on which hosts can profile which targets, refer to the table below and visit NVIDIA's website for additional information.
Link to section 'Installation' of 'NVIDIA Nsight Systems' Installation
- If you have an NVIDIA GPU on your local system, you can install Nsight Systems by visiting this link. With your local installation, you can collect profiling data from GPU-accelerated applications running on your system or connect to other devices via Bluetooth (for devices like Jetson) or SSH to profile code on remote computers.
- On RCAC clusters with NVIDIA GPUs (Gautschi, Gilbreth, Anvil, and Scholar), Nsight Systems is typically installed alongside CUDA in the same binary directory. Loading the CUDA module will automatically set the paths for both the CLI tool (
nsys) and the UI tool (nsys-ui) in your environment.
For example, on Gilbreth:
$ ml cuda/12.6
$ which nsys
/apps/spack/gilbreth-r9/apps/cuda/12.6.0-gcc-11.5.0-a7cv7sp/bin/nsys
In some cases, the tool may also exist separately within the CUDA directory. For example, we have another installation of Nsight Systems in the CUDA directory:
$ pwd
/apps/spack/gilbreth-r9/apps/cuda/12.6.0-gcc-11.5.0-a7cv7sp
$ ls
bin                gds       nsight-compute-2024.3.0  pkgconfig  tools
compute-sanitizer  gds-12.6  nsightee_plugins         README     version.json
DOCS               include   nsight-systems-2024.4.2  share
EULA.txt           lib64     nvml                     src
extras             libnvvp   nvvm                     targets
$ ls ./nsight-systems-2024.4.2/bin/nsys-ui
./nsight-systems-2024.4.2/bin/nsys-ui
Link to section 'Profiling and Analysis' of 'NVIDIA Nsight Systems' Profiling and Analysis
Link to section 'NVIDIA Nsight System CLI (nsys)' of 'NVIDIA Nsight Systems' NVIDIA Nsight System CLI (nsys)
First, ensure you have been allocated access to GPUs via the nvidia-smi command.
Provided you have access to GPUs, you can profile a GPU-enabled application from the command line using the nsys command:
nsys profile -o output_name ./your_application
Common options:
--gpu-metrics-device=all– Collects GPU performance metrics (only works for Turing and newer architectures)--trace=cuda,nvtx,osrt– Specify tracing for CUDA, NVTX, and OS runtime
For example, we can track GPU usage in machine learning training with:
nsys profile --trace=cuda,nvtx,osrt -o my_profile python train_model.py
This will create two files, my_profile.sqlite and my_profile.qdrep (or my_profile.nsys-rep depending on the version) which store the results of the profiling. To analyze results directly on the command line, you can then run the following command:
nsys stats my_profile.nsys-rep
This command will output several tables that may be of interest for GPU optimization. For the purposes of GPU benchmarking, the CUDA API summary table will contain the statistics for the runtimes of CUDA API functions:
 ** CUDA API Summary (cuda_api_sum):

 Time (%)  Total Time (ns)  Num Calls   Avg (ns)     Med (ns)    Min (ns)    Max (ns)   StdDev (ns)               Name
 --------  ---------------  ---------  -----------  -----------  ---------  ----------  -----------  ------------------------------
     87.9       94,864,569      2,560     37,056.5      7,260.5      5,496  15,974,993    575,765.3  cudaLaunchKernel
      3.9        4,182,395        484      8,641.3      9,363.5      3,857      42,452      4,478.2  cudaMemcpyAsync
      3.6        3,890,901        484      8,039.1      7,569.5      1,997      65,340      3,191.9  cudaStreamSynchronize
      1.9        2,021,777          2  1,010,888.5  1,010,888.5      2,769   2,019,008  1,425,696.3  cudaFree
      1.4        1,477,196          1  1,477,196.0  1,477,196.0  1,477,196   1,477,196          0.0  cudaHostAlloc
      1.1        1,206,049          8    150,756.1    147,012.0      4,340     394,302    139,253.6  cudaMalloc
      0.2          178,292        810        220.1        146.0         77       6,701        267.8  cuGetProcAddress_v2
      0.0           46,514         36      1,292.1        373.0        334      15,280      2,696.0  cudaEventCreateWithFlags
      0.0           11,710          2      5,855.0      5,855.0      4,559       7,151      1,832.8  cudaStreamIsCapturing_v10000
      0.0            9,806          3      3,268.7      2,574.0      2,232       5,000      1,509.1  cuInit
      0.0            2,630          3        876.7        506.0        117       2,007        998.0  cuModuleGetLoadingMode
      0.0            2,384          2      1,192.0      1,192.0        744       1,640        633.6  cudaGetDriverEntryPoint_v11030
If your program is frequently transferring a large amount of data to and from the GPU (for example, loading batches of training data), it may be useful to inspect the "host to device" and "device to host" memory copy times:
 ** CUDA GPU MemOps Summary (by Time) (cuda_gpu_mem_time_sum):

 Time (%)  Total Time (ns)  Count  Avg (ns)  Med (ns)  Min (ns)  Max (ns)  StdDev (ns)           Operation
 --------  ---------------  -----  --------  --------  --------  --------  -----------  ----------------------------
     65.7          466,364    324   1,439.4   1,408.5     1,343     2,016         62.3  [CUDA memcpy Host-to-Device]
     34.3          243,199    160   1,520.0   1,504.0     1,472     2,944        120.4  [CUDA memcpy Device-to-Host]

 ** CUDA GPU MemOps Summary (by Size) (cuda_gpu_mem_size_sum):

 Total (MB)  Count  Avg (MB)  Med (MB)  Min (MB)  Max (MB)  StdDev (MB)           Operation
 ----------  -----  --------  --------  --------  --------  -----------  ----------------------------
      0.247    324     0.001     0.000     0.000     0.005        0.001  [CUDA memcpy Host-to-Device]
      0.001    160     0.000     0.000     0.000     0.000        0.000  [CUDA memcpy Device-to-Host]
- An
nsysreport is a database of collected samples and derived metrics. Using thensysCLI, you can export the report into various formats, including SQLite, JSON, and more. - For more profiling options visit Nvidia Nsight documentation.
Link to section 'Limitations in Profiling' of 'NVIDIA Nsight Systems' Limitations in Profiling
For security reasons, some profiling options and results are not available for public use. Particularly, anything that utilizes performance counters on GPUs, or performs CPU sampling, are disabled. This means that capture options utilizing performance counters, or that otherwise require root access, will not be operational for general users. These options include:
--gpu-metrics-device=XXX--gpu-metrics-set=XXX--sample=system-wide--event-sample=system-wide--cpu-core-events=XXX--cpu-core-metrics=XXX--cpuctxsw=system-wide--run-as=XXX--ftrace=XXX
Link to section 'NVIDIA Nsight System GUI (nsys-ui)' of 'NVIDIA Nsight Systems' NVIDIA Nsight System GUI (nsys-ui)
If you'd prefer to analyze via a graphical interface, you can use nsys-ui both to load the profiling results and to profile.
Link to section 'Launching GUI' of 'NVIDIA Nsight Systems' Launching GUI
RCAC Clusters' nsys-ui App Launcher
In some of our clusters, we have an app-launcher for this tool:
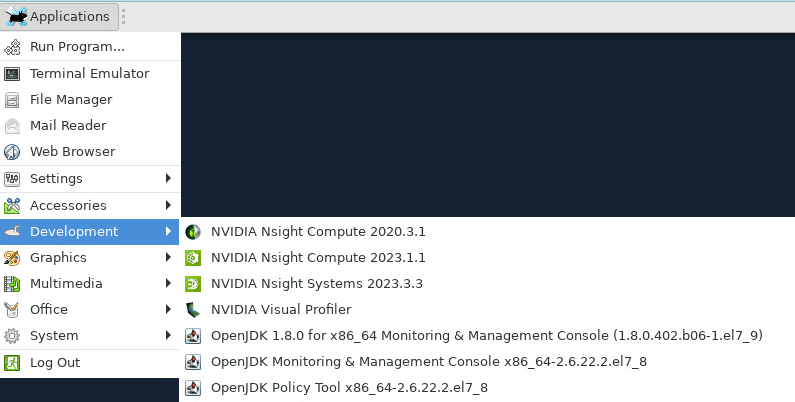
If the system provides an app launcher for nsys-ui, you can simply open it through the graphical interface without manually loading modules. Search for Nsight Systems UI in the application menu.
Launching Without an App Launcher
If an app launcher is unavailable, you may need to manually load the required modules before running nsys-ui.
- Prerequisite Modules:
# On Gilbreth:
$ ml cuda
$ ml qt
$ ml xcb-util-cursor
$ which nsys-ui
$ nsys-ui

# $ ml libxcb
# $ ml mesa-glu|mesa # (Likely required)
Link to section 'Profiling' of 'NVIDIA Nsight Systems' Profiling
- Load the modules and launch Nsight Systems UI
nsys-ui. - Specify the Profiling Target, which is the system where your CUDA application will run.
- You have the option to choose a remote machine with SSH and USB connection options. However, since this tutorial is focused on profiling applications running on the RCAC cluster, you need to connect to the Localhost, as it is already one of the RCAC nodes.
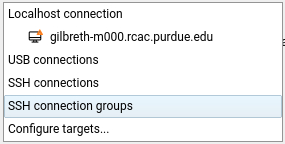
- Connect to the target machine.
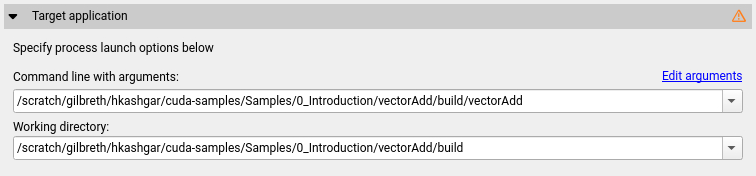
- Set up profiling configuration:
- Command Line with Arguments: Provide the path to the executable file. This is the only mandatory setting.
- Working Directory: Automatically set but can be changed if needed.
- Data Collection Settings:
- Note: Choosing too many metrics can introduce overhead, so enable only necessary ones. Consider tracing different events across multiple runs to minimize overhead.
- There are plenty of customization options, and you will need to enable only a small subset of collection metrics.
- An explanation of each option is available in the Nsight Systems documentation.
- Click Start to begin data collection.
- Then, it will create a Nsight Systems report after executing the application and display the collected metrics inside the GUI.
Link to section 'Loading Profiling results' of 'NVIDIA Nsight Systems' Loading Profiling results
- Load dependent graphical utilities:
module load xcb-util-cursor xcb-util-image xcb-util-keysyms xcb-util-renderutil xcb-util-wm, and launch the Graphical interface withnsys-ui(Or use the app launcher described above). - Open the
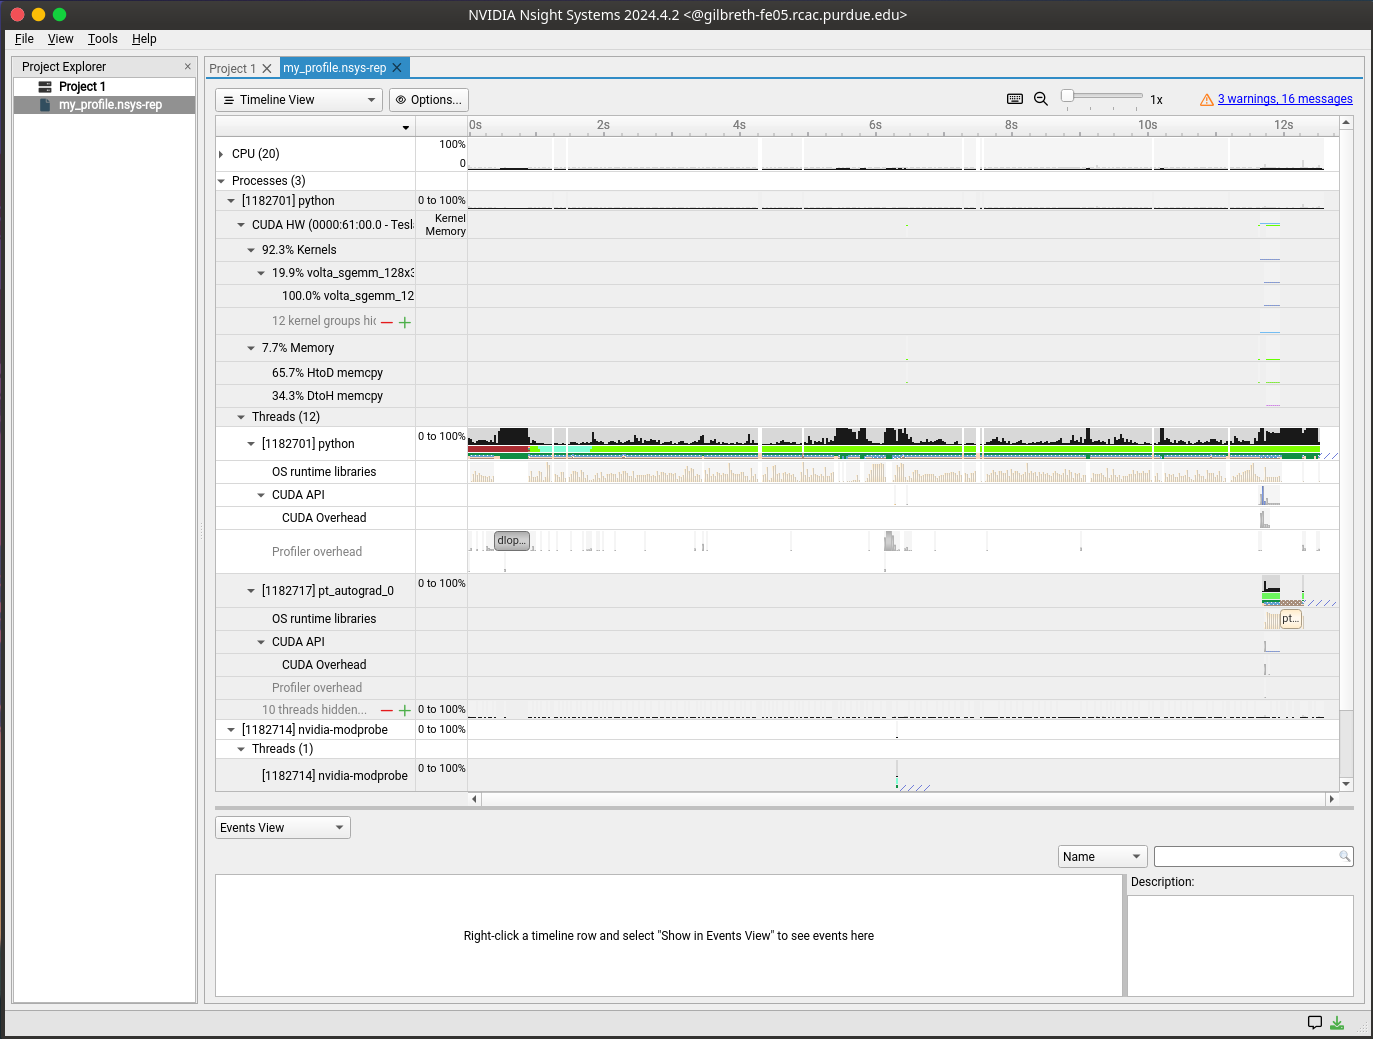
.nsys-repor.qdrepwith File > Open. - A timeline of the processes will load. The X axis represents the runtime, and the Y axis has a breakdown of each process. Within each process, you can view the memory copy and CUDA API events.
- You can highlight a portion of the timeline and right-click to zoom to selection.
- Right-clicking any row on the Y axis and clicking "show in events view" will provide a summary in the bottom of the window.
Link to section 'Interpreting Results' of 'NVIDIA Nsight Systems' Interpreting Results
Link to section 'Understanding Timeline View' of 'NVIDIA Nsight Systems' Understanding Timeline View
- CPU Rows: Show thread activity, API calls, and synchronization points
- GPU Rows: Display kernel executions, memory transfers, and hardware metrics
- Memory Rows: Indicate memory operations between host and device
- CUDA API Rows: Show CUDA API calls and their duration
Link to section 'Common Performance Patterns' of 'NVIDIA Nsight Systems' Common Performance Patterns
- GPU Idle Periods
- Look for gaps in GPU timeline
- Check for CPU bottlenecks or synchronization issues
- Consider using CUDA streams for better overlap
- Memory Transfer Bottlenecks
- Large host-to-device or device-to-host transfers
- Consider using pinned memory or unified memory
- Look for opportunities to reduce data movement
- API Call Overhead
- Frequent small kernel launches
- Consider kernel fusion or batching
- Look for unnecessary synchronization points
Link to section 'Troubleshooting' of 'NVIDIA Nsight Systems' Troubleshooting
Link to section 'Common Issues' of 'NVIDIA Nsight Systems' Common Issues
- Unable to Launch nsys-ui
- Ensure all required modules are loaded
- Check X11 forwarding if running remotely
- Verify GPU driver compatibility
- Profile Collection Fails
- Verify GPU allocation and access
- Check available disk space
- Ensure proper permissions
- High Overhead During Profiling
- Reduce the number of metrics collected
- Use shorter collection duration
- Apply appropriate filters
Link to section 'Error Messages' of 'NVIDIA Nsight Systems' Error Messages
- "No CUDA application was profiled": Ensure your application is using CUDA and GPU resources are available
- "Failed to load driver": Check CUDA installation and driver compatibility
- "Unable to connect to target": Verify SSH settings and network connectivity for remote profiling
Link to section 'FAQs' of 'NVIDIA Nsight Systems' FAQs
- Where are the logs stored?
- By default,
nsysgenerates.qdrep(or.nsys-rep) and.sqlitefiles, which store data in a format that thensys-uiapplication can easily understand. If you'd like to export the data in a friendlier CSV format, you can use the following:
nsys stats --export=csv -o output.csv my_profile.nsys-rep - By default,
For more details on using Nsight Systems, please check the NVIDIA Nsight Systems documentation and the User Guide.
Link to section 'Additional Resources' of 'NVIDIA Nsight Systems' Additional Resources
Link to section 'AMD uProf Usage Guide' of 'AMD uprof' AMD uProf Usage Guide
AMD uProf is a performance analysis tool for AMD processors and GPUs. It provides insights into application performance, including CPU/GPU usage, memory behavior, and threading efficiency. This guide outlines how to use AMD uProf on RCAC clusters.
Link to section 'Loading on RCAC Clusters' of 'AMD uprof' Loading on RCAC Clusters
AMD uProf is available on the gautschi cluster and can be loaded with:
ml amduprof
You can verify installation and version with:
AMDuProfCLI --version
Link to section 'Collecting Performance Data' of 'AMD uprof' Collecting Performance Data
Similar to other profiling tools, AMD uProf operates in two stages: data collection and analysis. Profiling can be performed via the CLI and later visualized using the GUI or text-based reports.
Link to section 'Basic Syntax' of 'AMD uprof' Basic Syntax
To collect data on an application your_app, use:
AMDuProfCLI collect --config <profile-type> --output-dir </path/to/output-dir> ./your_app [args]
This command collects data using the specified profile type and saves results in the output-dir directory.
Link to section 'Common Profile Types' of 'AMD uprof' Common Profile Types
tbp(Time-Based Profiling):- Collects periodic samples of function usage.
- Useful for identifying hotspots and frequently executing functions.
hotspots- Use this configuration to identify where programs are spending time and it’s callstack.
overview- Use this configuration to get an overall analysis and to find potential issues for further investigation.
threading(Threading Analysis)- Use this configuration to get an overall threading analysis and to find potential issues for further investigation.
memory(Cache Analysis)- Use this configuration to identify the false cache-line sharing issues. The profile data will be collected using IBS OP.
Link to section 'Analyzing Performance Data' of 'AMD uprof' Analyzing Performance Data
From the directory you specified during profiling, you are able to immediately create profiling summaries directly on the command line via the report option in uProf:
AMDuProfCLI report --input-dir /path/to/output-dir/AMDuProf...MMM-DD-YYYY_hh-mm-ss
This will result in a summary CSV file detailing your run
uProf also offers a Graphical User Interface to analyze profiling runs directly, and can be launched with the AMDuProf command, which will lauch the GUI:
In the GUI, open your result directory by navigating to “Import Session”, and open the /path/to/output-dir/AMDuProf...MMM-DD-YYYY_hh-mm-ss directory that was generated during your run
Link to section 'Example' of 'AMD uprof' Example
In this simple program, we have introduced several inefficiencies that we may be able to detect through uProf profiling.
#include <iostream>
#include <vector>
#include <chrono>
#include <thread>
#include <cmath>

void inefficient_function() {
    std::vector<double> data(10000, 0.0);
    for (int i = 0; i < 10000; ++i) {
        for (int j = 0; j < 10000; ++j) {
            data[i] += std::sin(j * 0.001);
        }
    }
}

int main() {
    auto start = std::chrono::high_resolution_clock::now();
    std::thread t1(inefficient_function);
    std::thread t2(inefficient_function);
    t1.join();
    t2.join();
    std::this_thread::sleep_for(std::chrono::seconds(2));
    auto end = std::chrono::high_resolution_clock::now();
    std::chrono::duration<double> diff = end - start;
    std::cout << "Program completed in " << diff.count() << " seconds.\n";
    return 0;
}
After we compile, we can collect a time based profiling run of this code with the following command:
AMDuProfCLI collect --config tbp --output-dir ./uprof_results ./test
This saves results to a ./uprof_results/AMDuProf-test-TBP_MMM-DD-YYYY_hh-mm-ss/ directory, which can be directly analyzed with either the AMDuProfCLI report option:
AMDuProfCLI report --input-dir ./uprof_results/AMDuProf-test-TBP_Jun-26-2025_11-46-26/
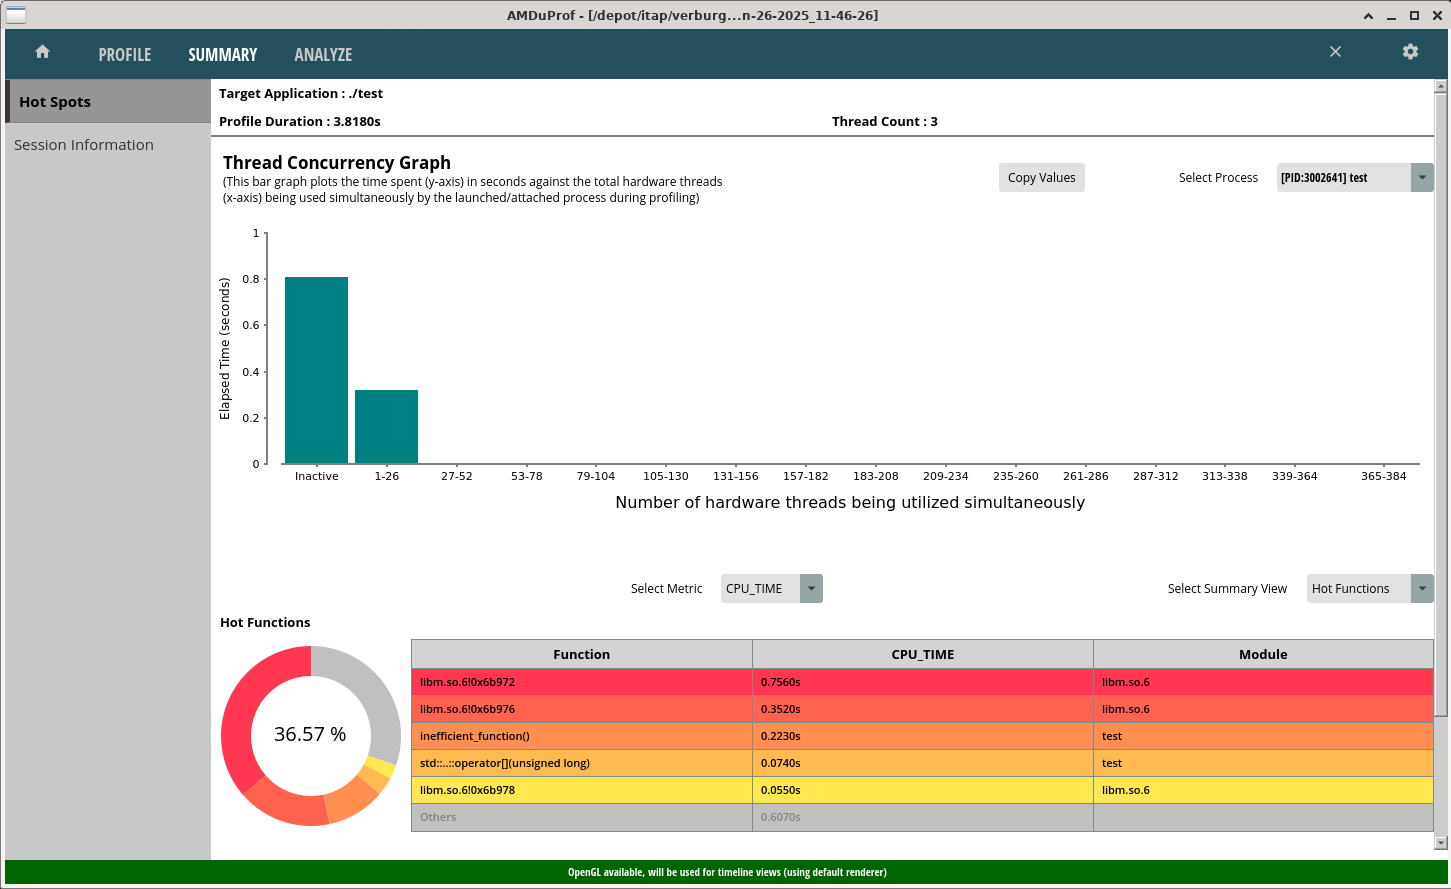
Alternatively, view results in the GUI via AMDuProf GUI
After loading the results in the GUI, you will be provided with an overview summary of the results, which provides a breakdown of where time is spent:
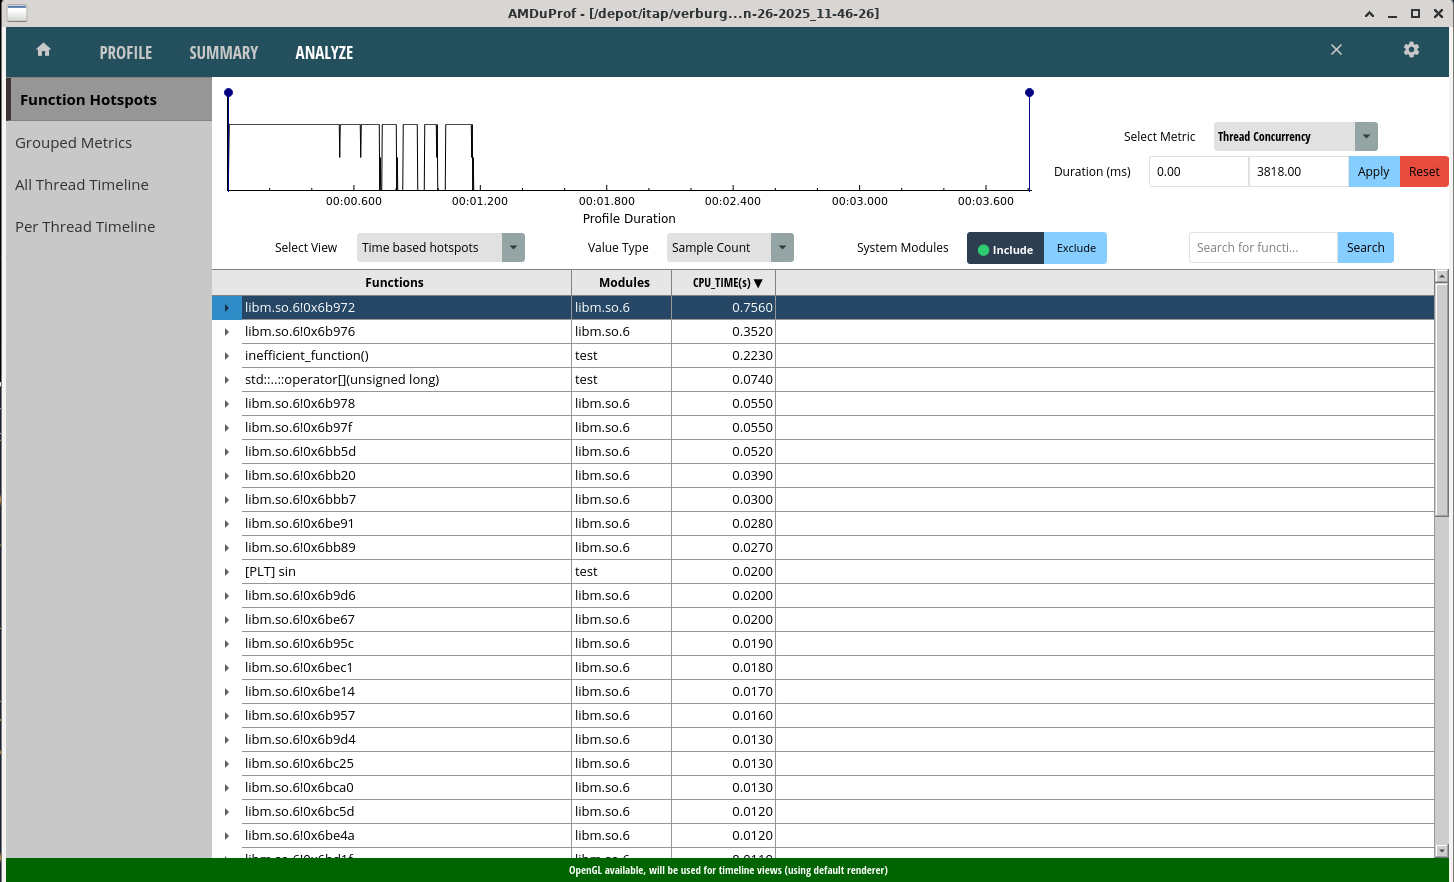
By navigating the the analysis tab, you will be able to see a timeline breakdown of the profiling run:
Link to section 'External Links' of 'AMD uprof' External Links
Link to section 'Intel Vtune Profiler CLI Usage Guide' of 'Intel Vtune' Intel Vtune Profiler CLI Usage Guide
Intel VTune Profiler is a performance profiling tool for analyzing CPU, GPU, threading, and memory usage. This guide outlines how to use the VTune on RCAC clusters.
Link to section 'Loading on RCAC Clusters' of 'Intel Vtune' Loading on RCAC Clusters
Intel VTune is installed on the gilbreth cluster as a module and can be loaded with the following commands:
ml intel-oneapi-compilers/2024.2.1
ml intel-oneapi-vtune/2024.2.1
You can verify the location and version of vtune with the following:
which vtune
vtune --version
Link to section 'Collecting Performance Data' of 'Intel Vtune' Collecting Performance Data
Like other profiling software. VTune functionson two primary steps, Collection and Analsyis. Although collection is possible through the GUI, it is often easier to collect profiling data directly on the command line, and to then open results in the VTune graphical interface.
To collect results on an application your_app, you would generally follow the following structure:
vtune -collect [collection_type] -result-dir ./vtune_results ./your_app [args]
This will run a specific type of collection on your code, and store the results in a directory vtune_results. There are many different types of data collection that may be ran, each collecting different data, at varying levels of resolution. Common collection tpes are:
hotspots: Time-consuming code sections.- This is useful for collecting high level information on which functions or sections of code are taking the longest in execution, and can identify bottlenecks.
gpu-hotspots: GPU-bound kernel hotspots.- This is useful for identifying which GPU kernels are consuming the most time, and whether GPU compute units are underutilized.
gpu-offload: GPU offload inefficiencies and host-to-device interactions.- This is useful for analyzing how effectively the CPU is offloading work to the GPU, including time spent in queues, memory transfers, and kernel launches.
threading: Thread usage overview.- This is useful for analyzing thread creation, synchronization, and parallel region utilization, helping to identify load imbalances or serialization bottlenecks.
system-overview: System-level overview- Not available to non-root users due to security reasons
- Would normally give a broad view of CPU, memory, I/O, GPU, and other system metrics (like thermal throttling) to detect macro-level system bottlenecks.
memory-access: Memory bandwidth and access patterns.- Not available on
Gilbreth - This would be useful for identifying memory latency and NUMA inefficiencies, and can distinguish compute-bound vs memory-bound behavior.
- Not available on
io: Provides information on IO operations.- Not available on
Gilbreth - This would be useful for analyzing file reads/writes, disk latency, and I/O wait time, especially in data-intensive programs.
- Not available on
performance-snapshot:- Not available on
Gilbreth - Would normally give a quick one-shot summary of system-level CPU, threading, GPU, and memory metrics, in a high-level overview.
- Not available on
Link to section 'Analyzing Performance Data' of 'Intel Vtune' Analyzing Performance Data
From the directory you specified during profiling, you are able to immediately create profiling summaries directly on the command line via the report option in VTune:
vtune -report summary -result-dir ./vtune_results -format csv -report-output ./summary.tsv
VTune also offers a Graphical User Interface to analyze profiling runs directly, and can be launched with the vtune-gui command, which will lauch the GUI:
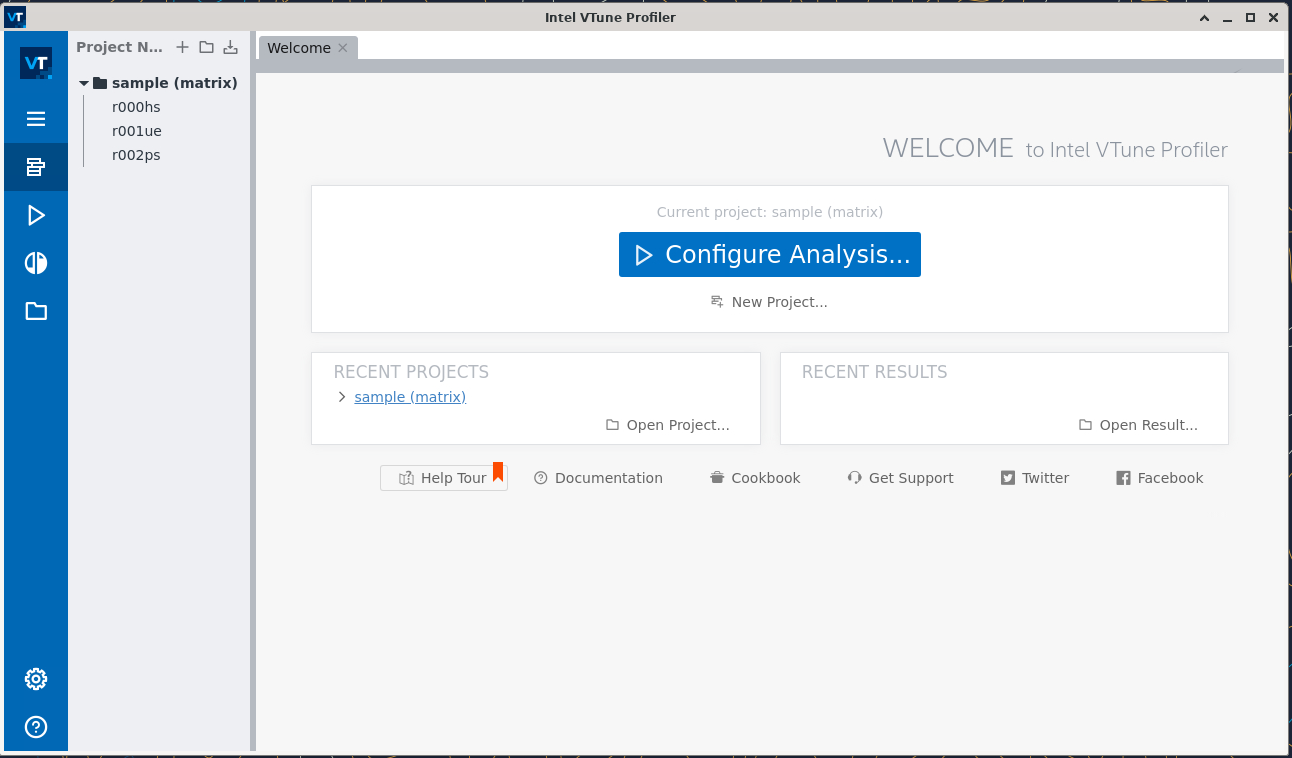
To load your existing results, you can use ctrl+o (or click on the hamburger menu on the left-hand toolbar > open > result folder) and navigate to /path/to/vtune_results/vtune_results.vtune.
Depeding on the profiling capture type, different visualizaiton and analysis options will be available. Using the tabs on the top of the window (when ersults are loaded) you will be able to navigate through the profiling resutls in varying levels of detail.
Link to section 'Example' of 'Intel Vtune' Example
In this simple program, we have introduced several inefficiencies that we may be able to detect through VTune profiling.
#include <iostream>
#include <vector>
#include <chrono>
#include <thread>
#include <cmath>

void inefficient_function() {
    std::vector<double> data(10000, 0.0);
    //Unnecessary nested loops
    for (int i = 0; i < 10000; ++i) {
        for (int j = 0; j < 10000; ++j) {
            //Redundant calculations (sin inside inner loop)
            data[i] += std::sin(j * 0.001);  // Expensive and repeated
        }
    }
}

int main() {
    auto start = std::chrono::high_resolution_clock::now();

    std::thread t1(inefficient_function);
    std::thread t2(inefficient_function);

    t1.join();
    t2.join();

    // Idle CPU time
    std::this_thread::sleep_for(std::chrono::seconds(2));

    auto end = std::chrono::high_resolution_clock::now();
    std::chrono::duration<double> diff = end - start;
    std::cout << "Program completed in " << diff.count() << " seconds.\n";

    return 0;
}
After we compile, we can collect poorly performing “hotspot” sections of this code with the following command:
vtune -collect hotspots -result-dir ./vtune_results./test
This saves results to a vtune_results directory, which can be directly analyzed with either the vtune -report option:
vtune -report summary -result-dir ./vtune_results -format csv -report-output ./summary.tsv
We can also visually analyze these results via the vtune-gui command, and opening the created vtune file with ctrl+o. This will open the summary page showing a general breakdown of wich sections and functions within the code were most time consuming:
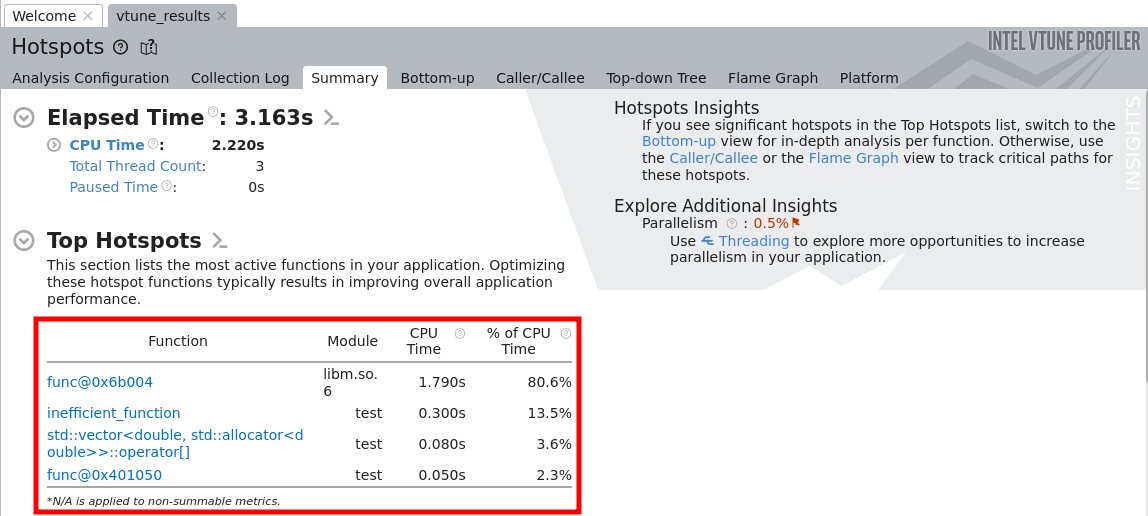
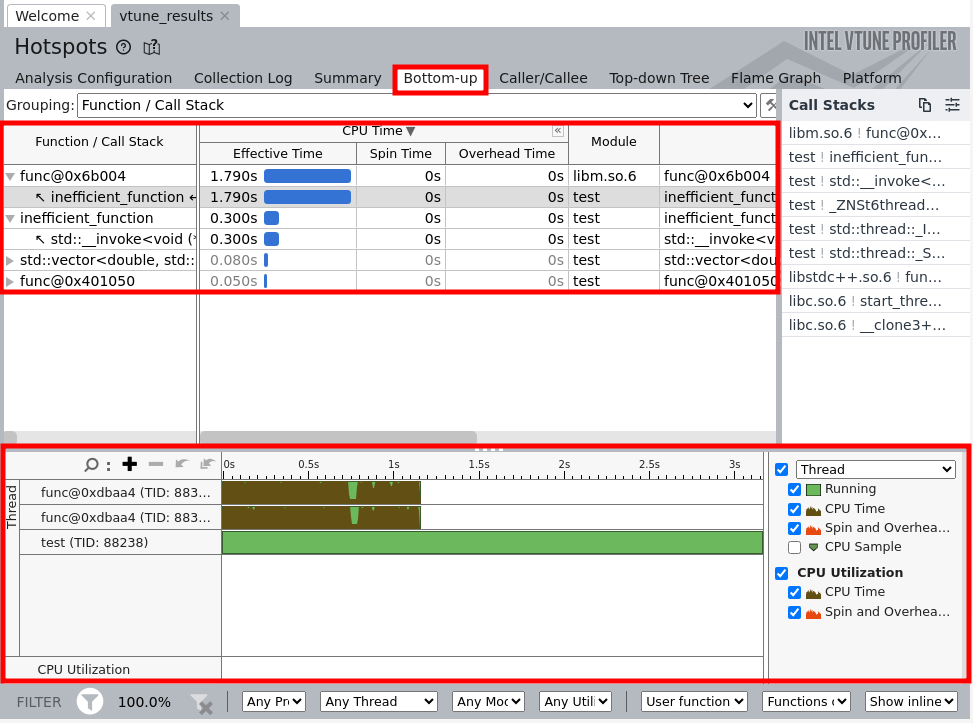
Further, by navigating to the “bottom-up” tab, you will be able to see a nreakdown of CPU and Overhead time for the duration of the profilnig run.
Link to section 'Limitations' of 'Intel Vtune' Limitations
- Several collection types (summarized above) are not available, either due to security restrictions to non-root users